
Post-surgery recovery tool for patients and a decision-support system for clinicians

Built for a surgery-agnostic 90-day clinical trial, designed as software as a medical device (SaMD).
This case study covers how research findings became design decisions, the patient side, the clinician side, and designing inside SaMD limits.
This is an ongoing project, confidential under an NDA, so the screens aren’t shown here. This case study gives a glimpse of how I approached it and the decisions that shaped it, and I’m glad to go deeper in an interview.
- Role
- Sole Product designer
- Scope
- UX/UI design, research synthesis, information architecture, SaMD-constrained design, design system, prototyping
- Time
- January 2026 – Present
- Location
- London
- Team
- PM and 3 engineers
The Problem
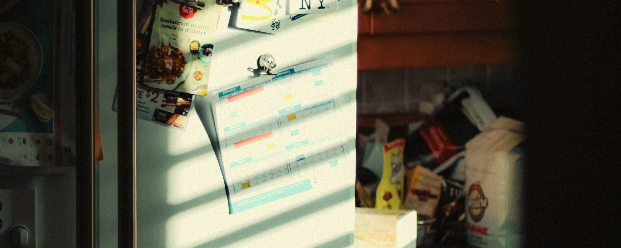
The sheet on the fridge
Imagine a kidney transplant patient, discharged with a sheet: eat this, avoid that, drink this much. It has to cover the weeks between clinic visits. It’s the same sheet for everyone with that operation, and it’s the same on day 3 as on day 60, whatever the bloodwork says.
They are in pain, short on sleep and overloaded with information. They want to do the right thing, and they are afraid of getting it wrong. For a few days they follow it closely. Then the pain, the sleep and the routine take over, and it gets forgotten.
The care team judges recovery on three things: whether the new kidney is settling, whether the wound is closing, and whether metabolic markers are recovering. Blood tests answer those every few weeks. In between, most of the food decisions that shape recovery happen at home, with nobody checking them.
Ultimately the sheet goes on the fridge.
What the trial is meant to answer
Post-op nutrition guidance is static, generic, and quietly ignored right when the body is doing the most consequential work it will ever do. So the question we set out to answer is:
Can daily personalised nutrition guidance improve a patient’s post-surgery recovery biomarkers over 90 days?
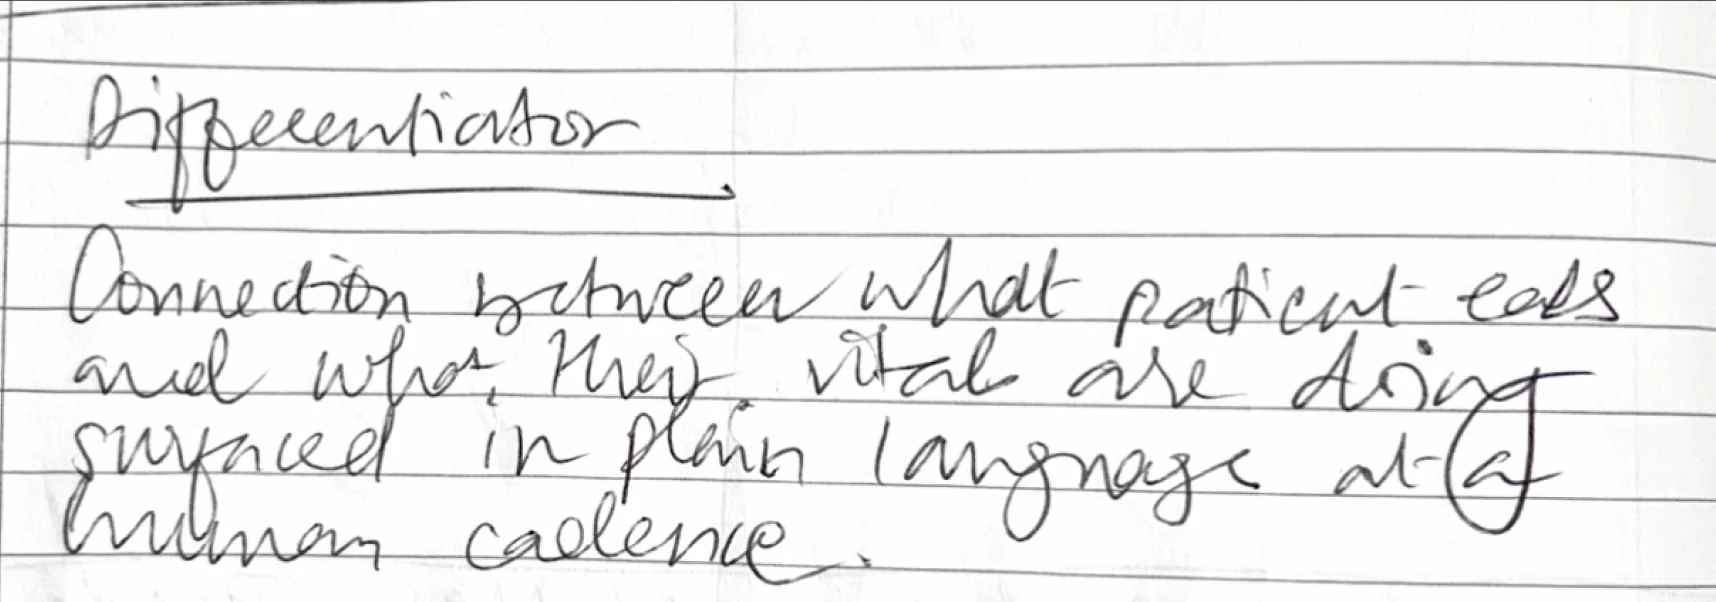
A 90-day biomarker trial has a hidden dependency, it’s the patient logging honestly for three months.
Why honest logging is fragile
I mapped the clinical logging landscape, reviewed multiple products. The research set the problem before any screens existed.
Logging in recovery isn’t a neutral act. It was handed to the patient as an instruction.
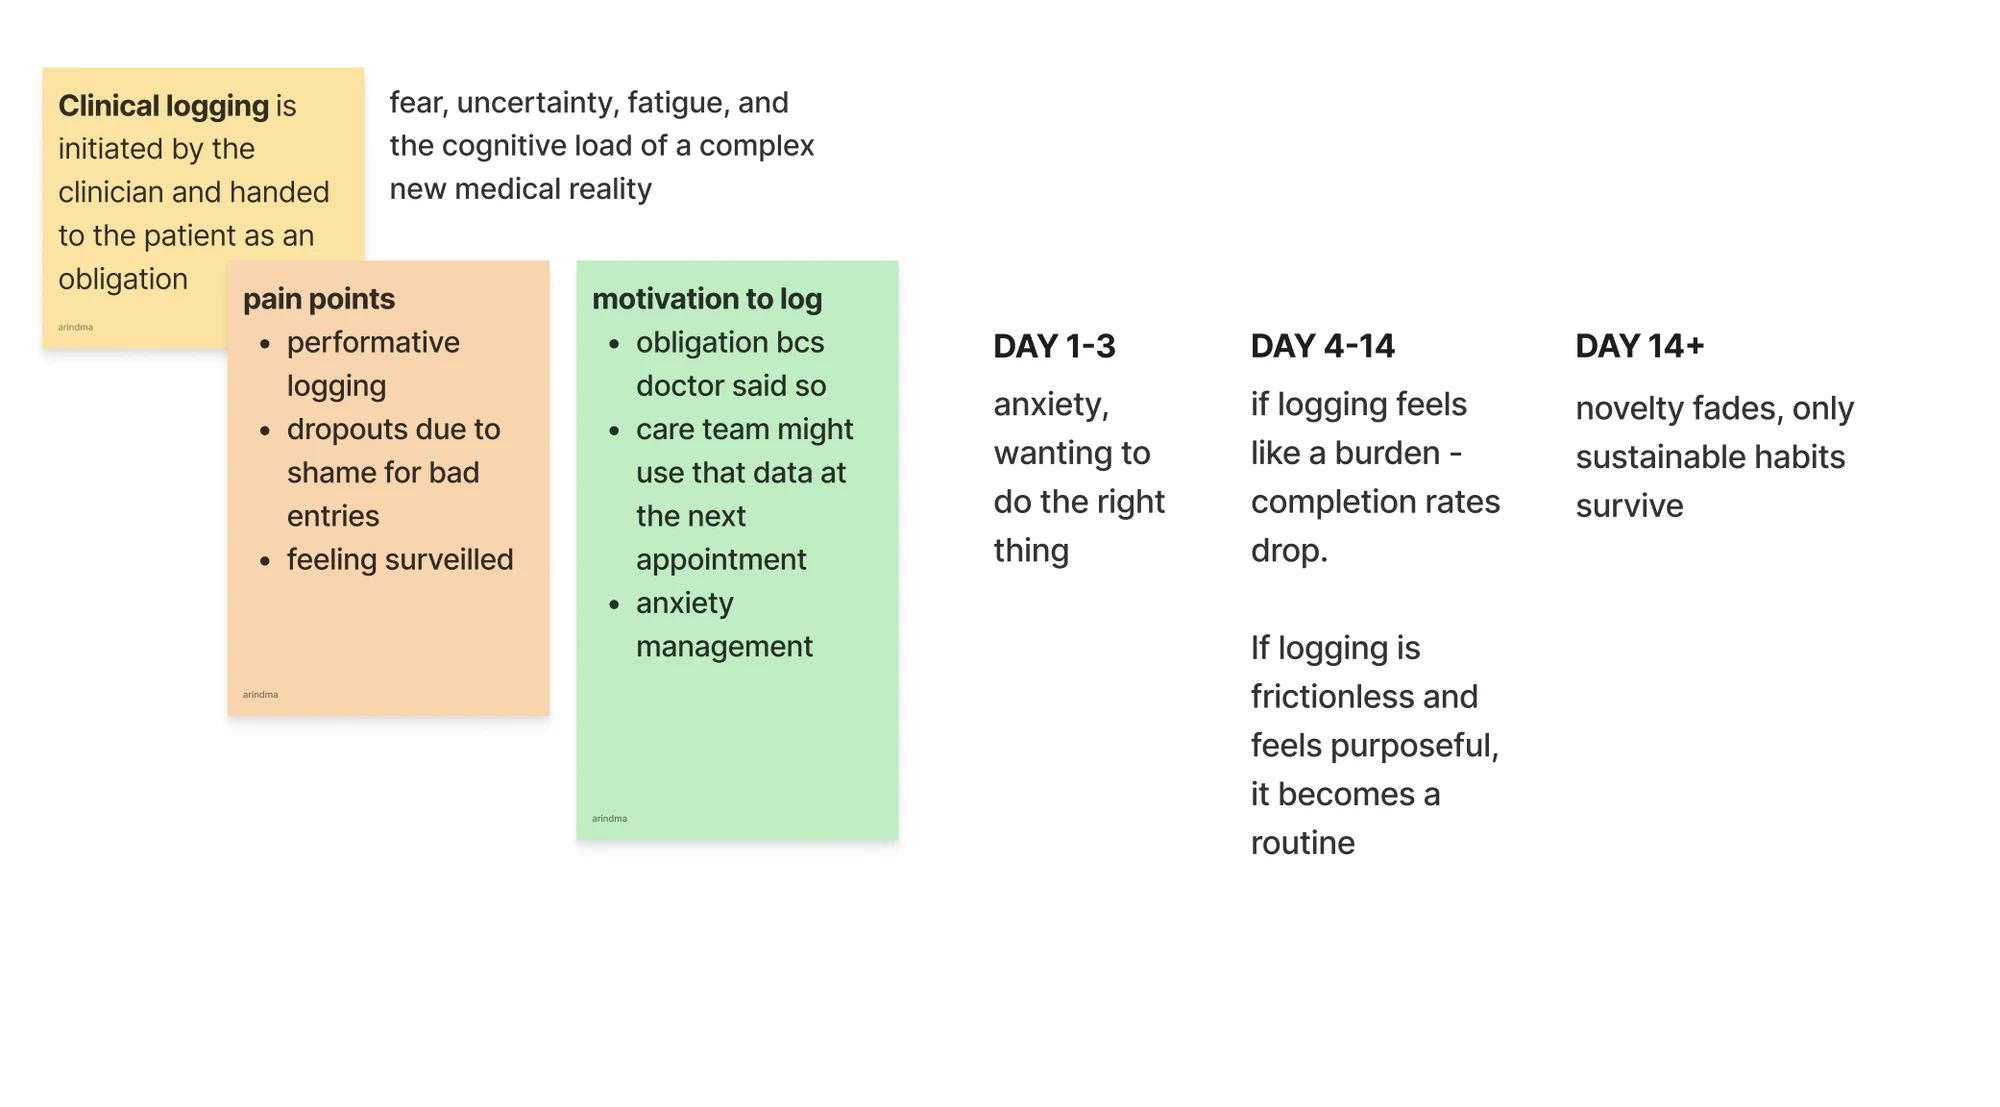
Turning research findings into design decisions under SaMD constraints
The review showed where logging breaks down: diaries ask people to remember meals, look up portions and type them in, and most tools treat every entry the same. Each finding became a decision.
- Logging is hardest on a bad day. So there are four ways to log: a photo, saying what you ate in your own words, typing a dish, or logging a recommended recipe. The patient picks whichever suits how they feel.
- Portions and ingredients are where people give up. So photo logging detects the contents, and the patient can remove or add an ingredient in seconds. The AI calculates close to exact macros from the picture alone.
- Guidance is ignored when it isn’t tied to the patient’s own meals. So the flag appears on the food that stood out, at the moment of logging, and it’s personalised to the patient’s surgery, conditions, allergens and dietary preferences.
- SaMD rules forbid diagnosis and clinical inference. So each flag explains what the food contains, not what it means for the patient’s readings.
What has to be true for logging to last
Three things decide whether logging lasts:
- The patient believes their logs affect their care, so each log needs a visible acknowledgement.
- The patient can see patterns in their own data.
- Logging takes little effort, so there are few required fields.
The hardest is making logs feel meaningful without making them heavy. Each design decision below answers one or more of these.
The patient side
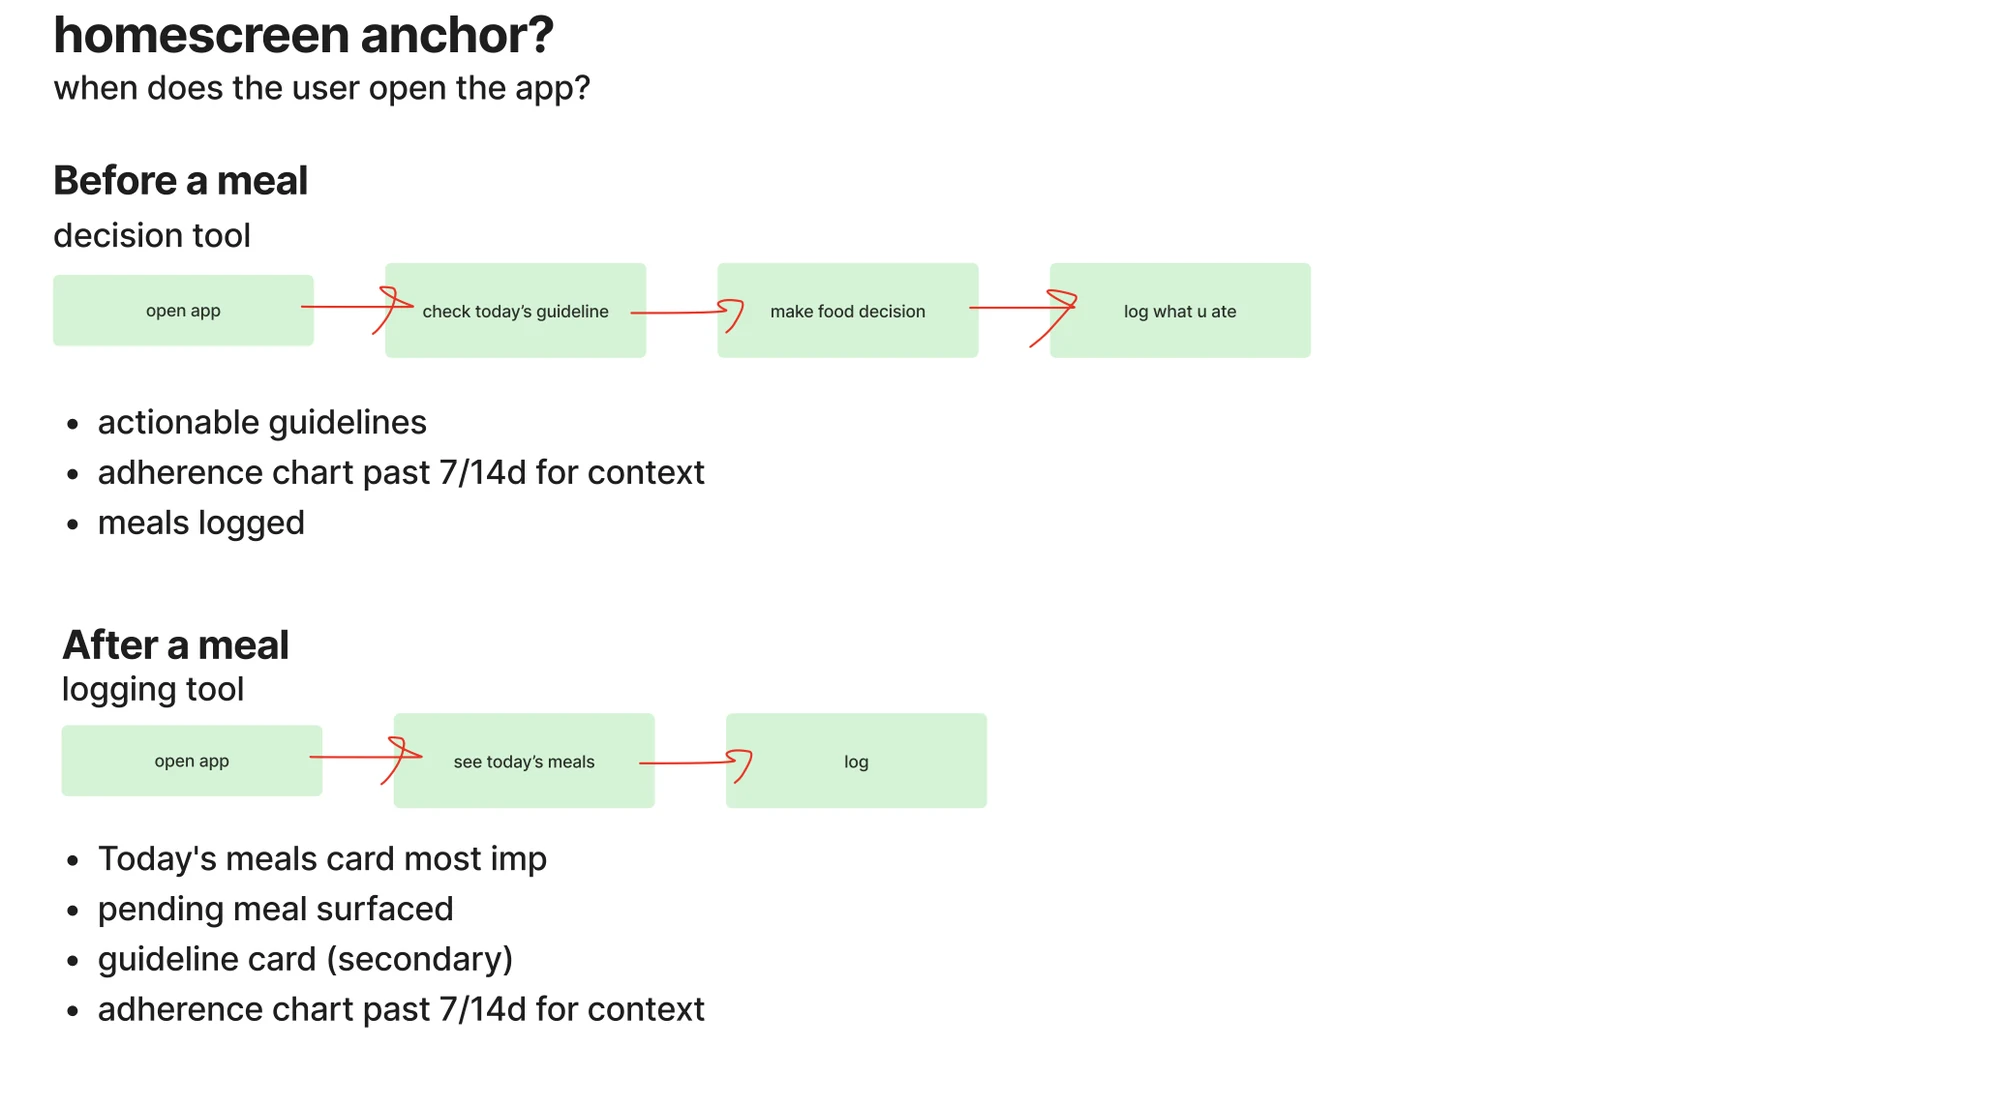
Guidance at the moment of food decision
Guidance that’s there when the food decision is being made everyday. The tool shows what’s left for the day against the daily targets for macros and micronutrients that matter most in recovery. It also shows what fits the next meal, and why.
It gives one thing to focus on. Recovery looks different day to day so the guidance updates from what the patient logs, where they are in their recovery.
Make logging easy enough to keep up
Logging is hardest for a patient who is anxious and low on energy. A food diary asks them to remember what they ate, look up portions and type it in, on a day when they are tired and worried about getting it wrong. So the first goal was to make logging quick enough to do on a bad day.
A photo is the quickest route. The patient photographs the plate, checks what the tool has picked out, and the meal is logged. Nothing needs looking up. The aim is an entry that takes seconds, so the record still gets filled in on the days that matter most.
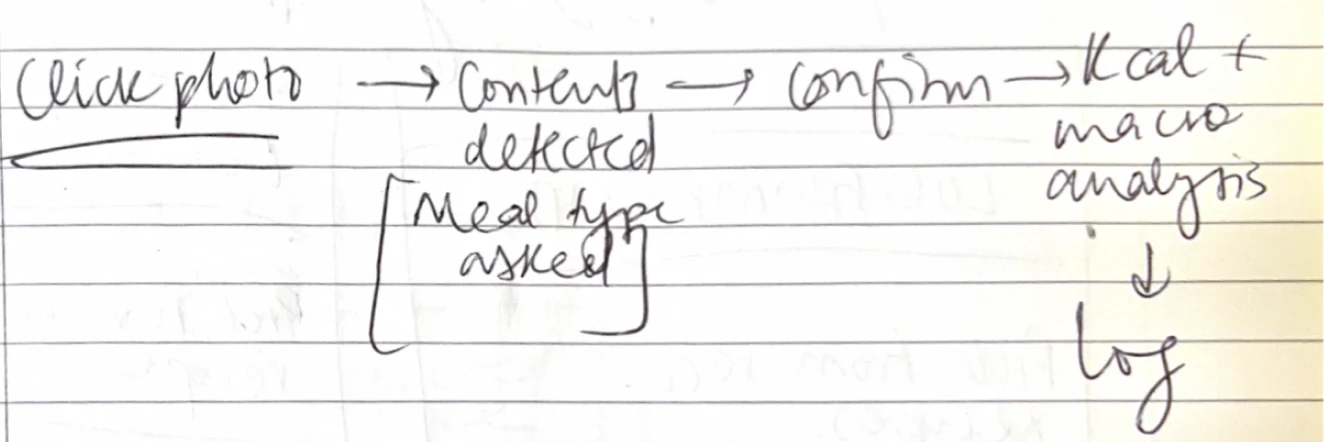
The logging moment is also where the teaching happens. Once the meal is logged, the patient sees a highlight or a flag on the food that stood out, such as:
“Guacamole is high in potassium. Two cups use a real share of your daily allowance.”
The insight is small and tied to a plate they have just eaten. They absorb an insight attached to their own behaviour, repeated over time. When guacamole turns up again, the patient simply knows its high in potassium.
So logging does two jobs at once. It keeps the record complete enough for the trial, and it gives the patient something they keep.
What a missed day looks like
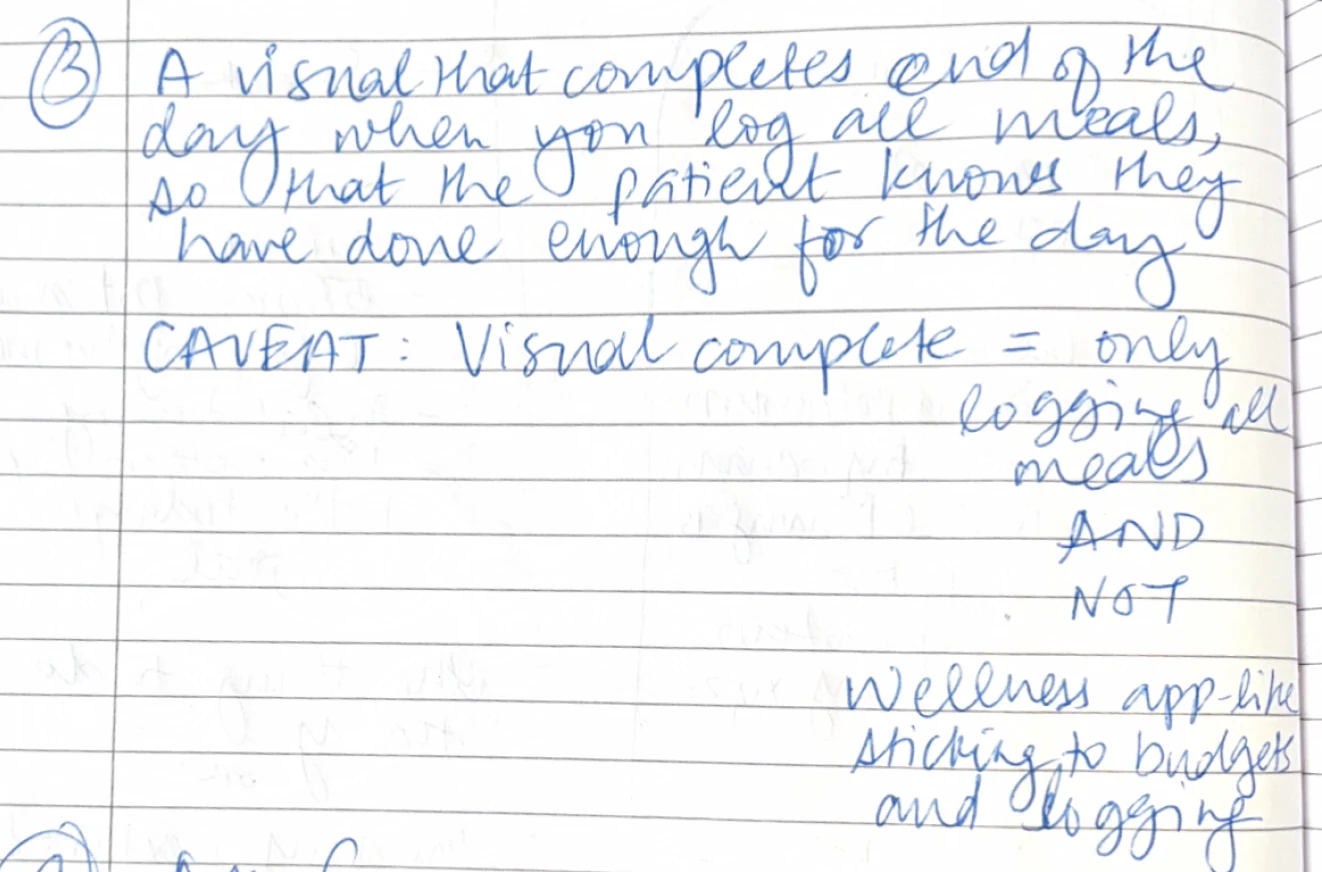
Recovery isn’t linear. Some days go well, some don’t, and a bad stretch is part of the picture. The weekly record reflects that. Each day shows as on track, over target, or not logged, and not logged is a neutral state.
Nothing counts down or resets, so there are no streaks and no falling scores. When a pattern shows up, it points to one thing to try next. The aim is that a missed day never becomes the reason to stop logging.
What the tool won’t do
This is a software as a medical device (SaMD), and that draws hard lines around what the tool is allowed to do. It can’t diagnose. It can’t advise on medication. It can’t make clinical inferences.

Its job is to explain the guidance in plain language, and why it applies at this point in recovery. Patients want to know whether the guidance is working, and the trial exists to find out. Adherence and biomarkers never share a chart, and general statements are conditional. “Can help” and “is linked to” are allowed. “Helped your readings” is not.
These limits shaped the design. Anything beyond explaining goes back to the care team.
The health view escalates in plain language: “Speak to your care team. Your temperature’s been above your usual for 36 hours alongside an elevated heart rate.”
The clinician side
I reviewed multiple products across remote monitoring, clinic portals and dietitian software.
Honest patient data is worthless unless it reaches the clinician in a form they can act on, and unless the outcome gets measured against ground truth. That’s the second half of the system.
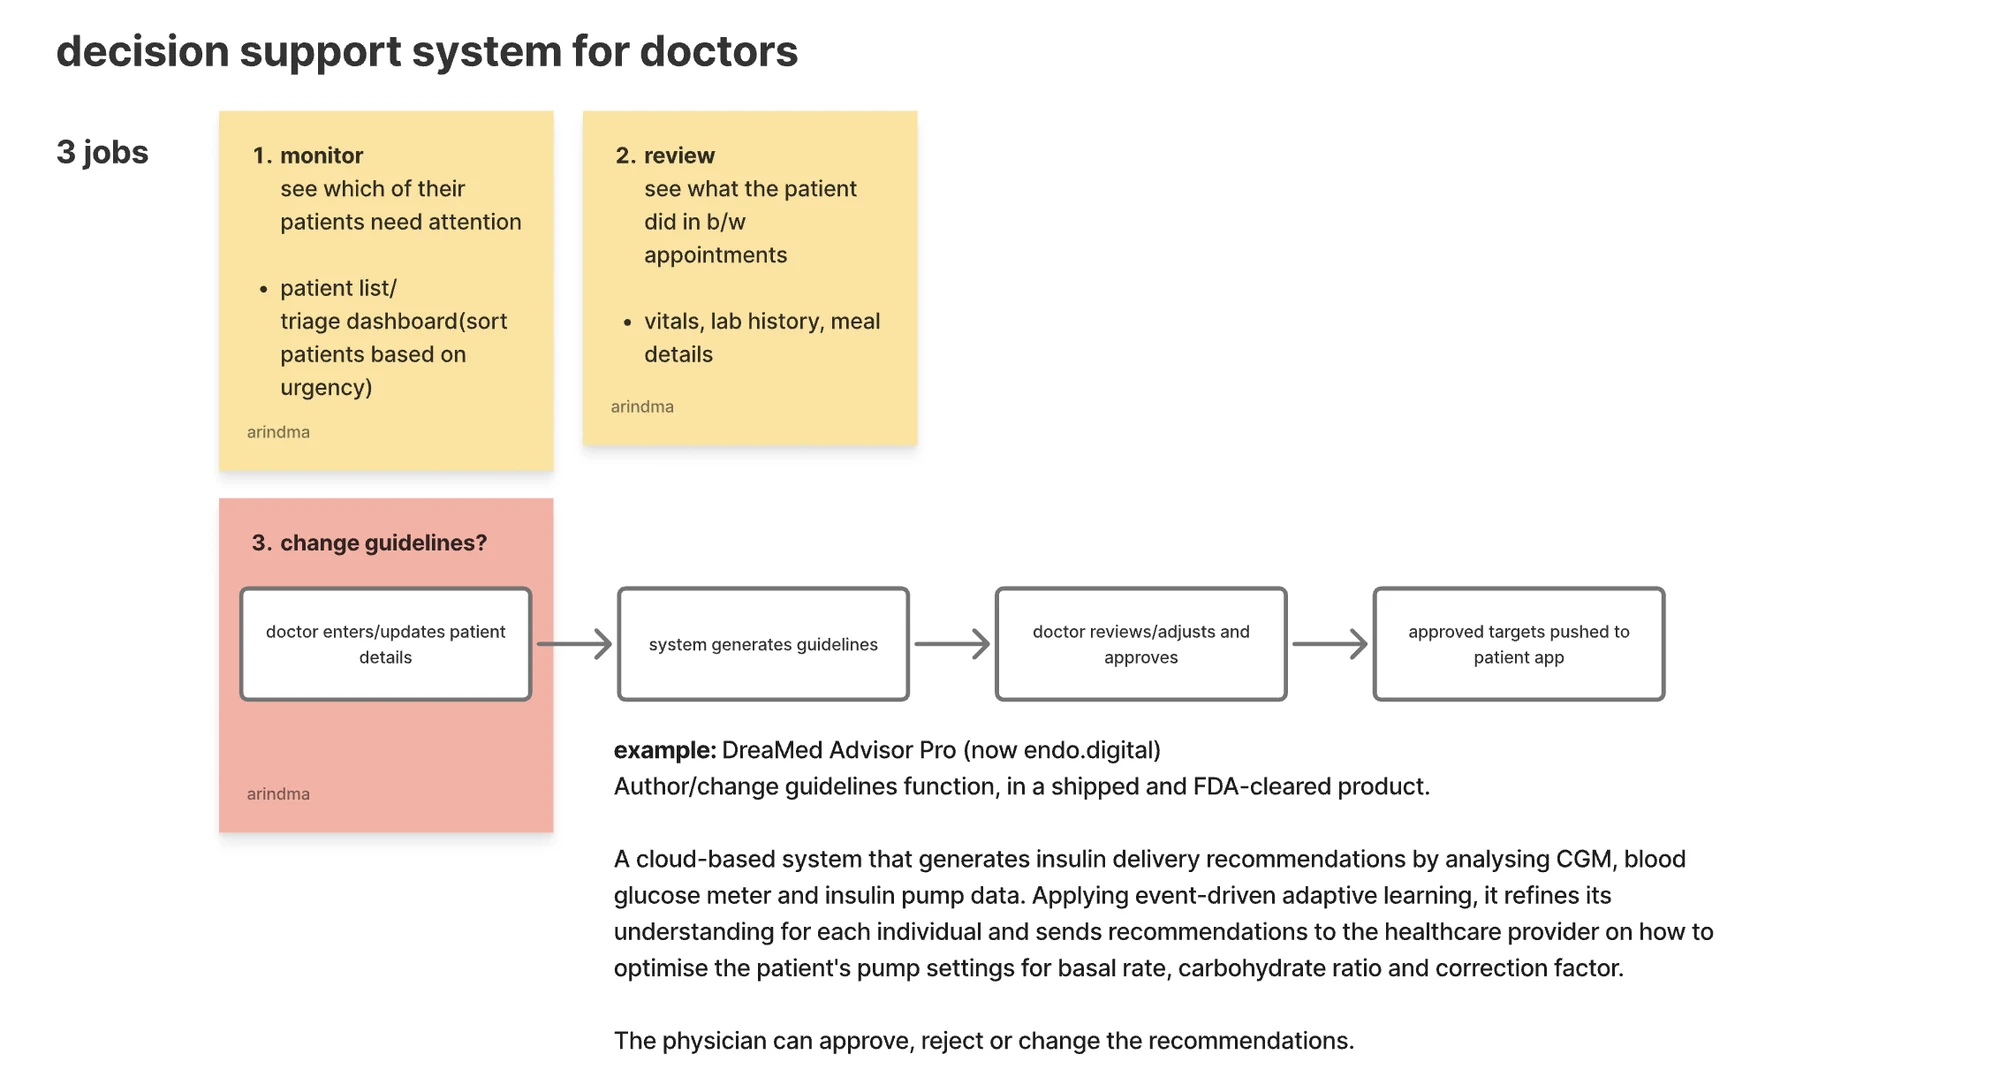
The clinician dashboard does three jobs:
- Monitor: who needs me first. A triage view that ranks patients by how far their signals have drifted, so the clinician opens the person who needs them, not whoever’s alphabetically first.
- Review: what happened between appointments. Vitals, wearable data, the meal record, the patterns, the context a 15-minute appointment never has room for.
- Adjust: change the guidance. The clinician reviews the drafted guidelines, edits, approves, and the new targets flow straight to the patient’s app.
Challenges
Designing inside SaMD limits
The app can’t diagnose, can’t advise on medication, and can’t go beyond telling someone what to eat. The hard part is that patients ask all three anyway. I wrote the copy rules before designing any state, then checked each state against them. Anything that looks serious goes to the care team.
Designing for anxiety
Anxious patients are the ones most likely to hide a bad day, and a hidden day is exactly what the trial can’t use. A skipped lunch on a painful day shouldn’t leave someone feeling behind when they open the app that night. So a missed meal shows as a grey day, nothing counts down, and the record carries on the next morning as if nothing had broken. Streaks would have helped motivation, and I left them out on purpose.
Designing for two users in one tool
The clinician and the patient work from the same data but need opposite things from it. The clinician needs to see who to call first, so colour and ranking earn their place. The patient must never see that signal, because a red number on a meal sends an already anxious person into a worse week. I defined the shared data first, then designed each side for its own user.